Abstract: In response to the increasing energy density of electric vehicle power batteries and the problem of high heat generation during fast charging, this paper proposes a new type of refrigerant direct cooling battery thermal management system that uses honeycomb single-sided blown aluminum plates as battery cooling plates, fully utilizing the high boiling heat transfer latent heat of refrigerant in the flow channel to treat the thermal load of power batteries. In order to study the operational performance of this refrigerant direct cooling and heating management system, a new experimental testing device for the direct cooling system was constructed, and experimental research was conducted under the UDDS standard operating conditions. The test results show that at the maximum design heat output of 6 kW, the system can quickly respond to thermal management requirements in about 150 seconds and has fast temperature response characteristics; The average surface temperature of the battery cold plate can be controlled within the optimal temperature range of 15-20 ℃, achieving good temperature uniformity with a temperature difference of less than 4 ℃, and the system COP is stable above 2.8.
1. New Type of Blowing Expansion Cold Plate Direct Cooling System 1.1 System Principle
The topology structure of the new type of blow blown cold plate direct cooling system (hereinafter referred to as the direct cooling system) is shown in Figure 1. The direct cooling system consists of main components such as an electric vortex compressor, a parallel flow microchannel heat exchanger, a battery cooling plate, an electronic expansion valve, a liquid reservoir, and a gas-liquid separator. The working principle of the direct cooling system is as follows: the high-temperature and high-pressure refrigerant vapor discharged by the electric compressor 1 is condensed by the external heat exchanger 2, and then divided into two sub circuits after the liquid storage tank 4. After passing through the electronic expansion valves 5 and 9, it enters the battery cooling plate 6 and the internal evaporator 10 for evaporation and heat absorption. It converges and flows through the gas-liquid separator 13 to return to the compressor in an overheated state, completing a complete direct cooling cycle.
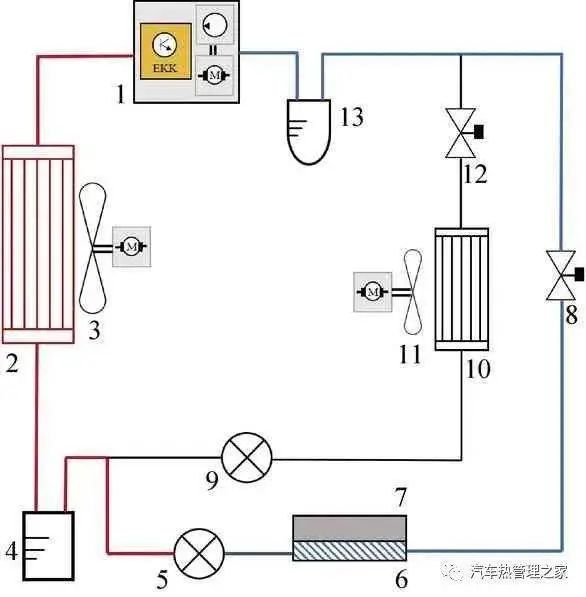
1. Electric compressor; 2 external heat exchangers; 3,11 fans; 4 fluid reservoirs;
5,9 Electronic expansion valve; 6 battery cold plate; 7 Simulated heat sources; 8, 12 solenoid valves;
10 in cabin heat exchangers; 13 Gas liquid separator.
Figure 1 System topology diagram
Fig.1 Topography structure of the system
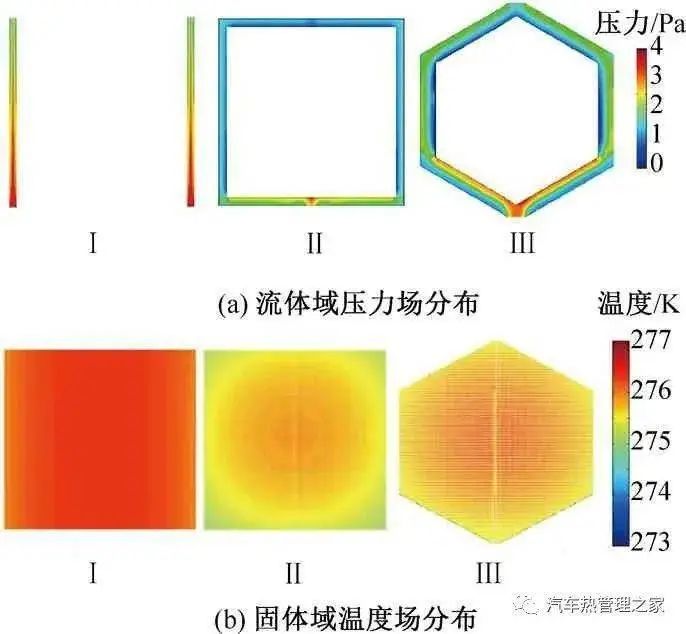
Figure 2 Simulation Results of Flow Channels with Different Structures [16]
Fig.2 Simulation result of various flow channel unit[16]
1.2 Battery Cold Plate Design
The traditional harmonica tube flow channel has the disadvantages of difficult diversion and small heat transfer area. Figure 2 shows the simulation results of three different channel unit structures. The solid domain of the heat transfer unit is equipped with an internal heat source, and the outer wall is convective heat transfer with the environment. The medium flows through three different channel structures to cool the simulation unit. On the premise of equal computational domain area and the same simulation conditions, compared with the traditional harmonica tube cold plate structure (I), the flow resistance of the quadrilateral channel (II) and the honeycomb channel (III) increases, but the average temperature in the solid domain of the honeycomb channel (III) is lower than that of I and the overall temperature difference is smaller. This indicates that III can effectively enhance fluid solid coupling heat transfer, improve heat transfer efficiency, and achieve better temperature uniformity performance on the solid domain side.
Based on the above academic ideas, this article designs and trial produces a new honeycomb shaped single-sided blown aluminum plate as shown in Figure 3. The structure of the contact side between the battery cold plate and the power battery is flat, suitable for mainstream square battery modules, and the lower surface is a honeycomb shaped hexagonal channel. The width of the flow channel for the trial produced battery cold plate is 10 mm, the height of the flow channel is 3 mm, the overall thickness of the battery cold plate is 5 mm, and the area of a single battery cold plate is 0.56 m2.

Figure 3: Structure of the upper and lower surfaces of the battery cold plate
Fig.3 Structure of the top and bottom surfaces of the battery cooling plate
1.3 Experimental System
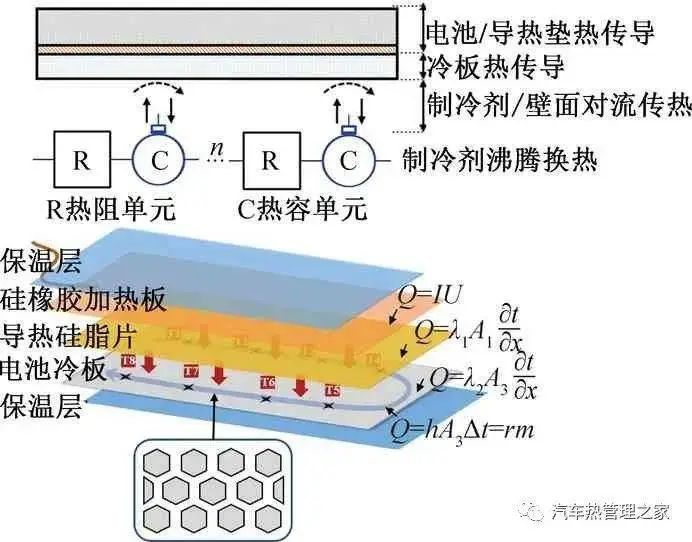
The sandwich structure on the side of the battery cold plate is shown in Figure 4. The side of the battery cold plate is a 5-layer sandwich structure. A thermal conductive gasket with a thickness of 0.5 mm is laid between the heating plate and the battery cold plate. A 2mm thick insulation plate is arranged at the bottom and top, and the entire side of the battery cold plate is sealed with high viscosity foam to reduce heat leakage from the simulated electric heating source and eliminate the influence of environmental temperature on the experimental system. Based on the actual distribution of battery modules, K-type thermocouples are arranged on the surface of the cold plate at the center point of each module along the process to measure the surface temperature of the battery cold plate. The distribution of temperature measurement points T1 to T8 is shown in Figure 4. The heat transfer process on the cold plate side of the battery consists of four heat transfer stages, and the heat balance relationship is shown in equation (1).
Figure 4: Sandwich structure on the side of the battery cold plate
Fig.4 Multilayer structure of the test system for the battery cooling plate
(1)
In the formula: I and U are the current and voltage measured by the voltage regulator, A and V; λ 1 and λ 2 are the thermal conductivity coefficients of thermal conductive silicone grease and battery cold plate, W/(m · K); H is the heat transfer coefficient of the convective heat transfer surface inside the plate, W/(m2 · K); Δ T is the temperature difference between fluid and solid, K; r is the latent heat of refrigerant vaporization, J/kg; qm is the mass flow rate of refrigerant, kg/s; Ai (i=1,2,3) is the heat transfer area of each stage, m2.
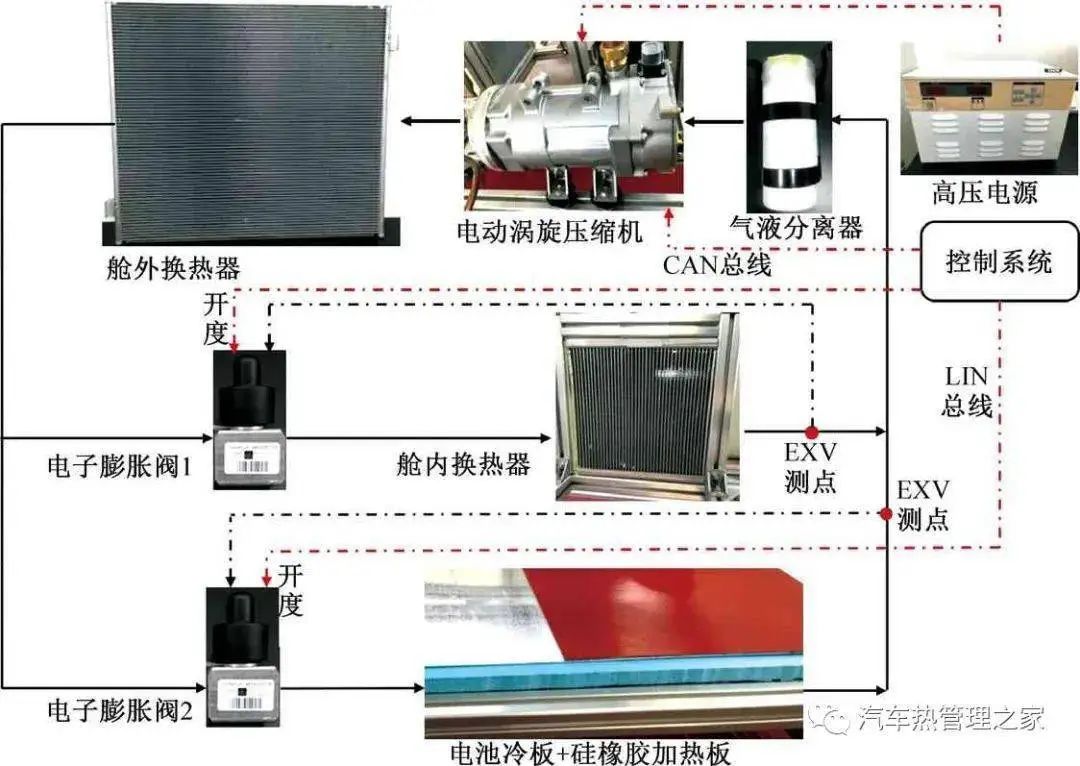
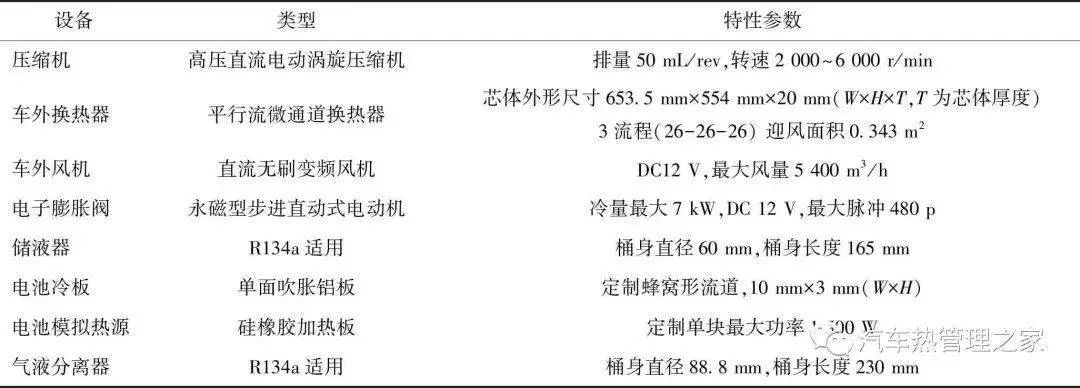
Based on the above battery cold plate side testing structure, build a testing bench as shown in Figure 5. The compressor communicates with the control system through CAN bus to adjust the speed. The electronic expansion valve opening is adjusted through LIN bus based on the superheat at the outlet of the battery cold plate. The air volume of the outdoor fan is adjusted by adjusting the fan voltage. The test prototype uses 8 sets of silicone rubber heating plates to simulate the heating power of the power battery. The size of the heating plates is customized according to the module size, with a single heating plate size of 306 mm x 735 mm. The simulated heat source is equipped with a high-power regulator, which adjusts the heating power by adjusting the power supply voltage. The refrigerant used in the system is R134a, which utilizes the latent heat of vaporization of the refrigerant to absorb heat from the heat source. Combined with the thermodynamic characteristics of the refrigerant in the two-phase region, which ignores the pressure drop and maintains a constant temperature, efficient cooling and temperature uniformity performance of the battery module are achieved. The upper computer of the system uses NI LabView to control the system compressor and other components, as well as to collect and store some data. The thermocouple temperature is collected using the Agilent 34901 module. All connecting pipelines of the system are arranged with insulation cotton to reduce pipeline heat leakage. Each working condition is preheated for 15 minutes, and the testing time is 10 minutes. The stable part of the system performance parameters is taken for data processing and test result analysis. The key component characteristic parameters of the new blowing expansion cold plate direct cooling system are shown in Table 1.
2 Experimental Results and Error Analysis 2.1 System Uncertainty Analysis
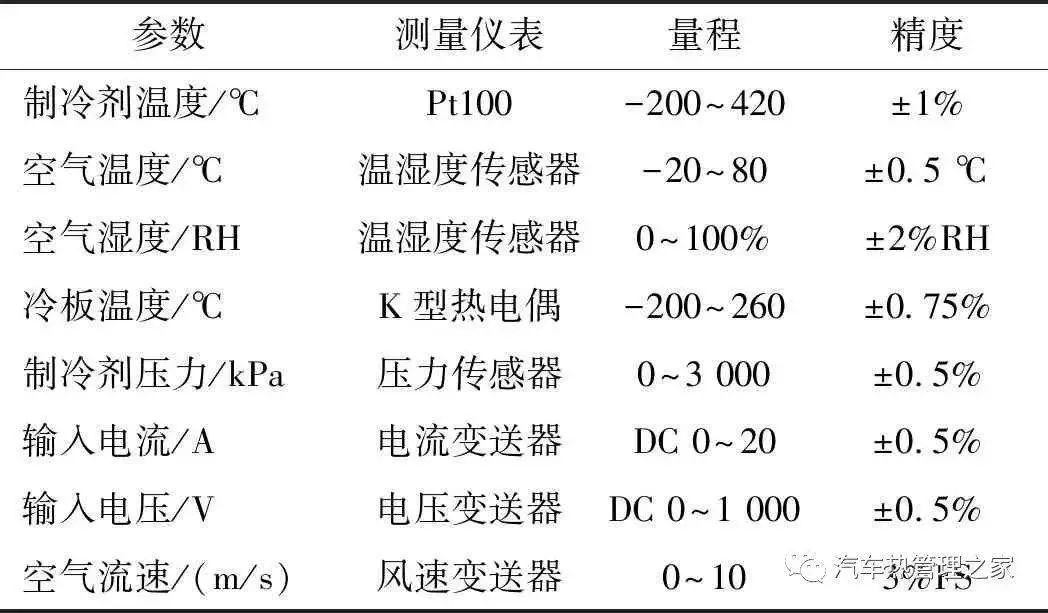
The main components of the direct cooling system are equipped with high-precision platinum resistors and pressure sensors at the inlet and outlet. The power of the electric compressor is measured through a DC voltage and current transmitter, while the power of the simulated heat source is obtained by comparing the readings of the voltage regulator with the measured current. Temperature and humidity sensors are installed at the inlet and outlet of the air side, and the air flow rate is measured using a high-precision wind speed transmitter. The surface temperature of the cold plate is measured using a K-type thermocouple. The main measurement instrument parameters of the system are shown in Table 2.

Figure 5 Schematic diagram of the testing system
Fig.5 Schematic diagram of the test system
Table 1 Key Component Parameters
Tab.1 Specifications of components
In order to evaluate the system performance of the refrigerant direct cooling and heating management system, it is necessary to use the measured experimental data to calculate system performance parameters such as power consumption, heat transfer, and COP.
Thermodynamic equilibrium of system components [17]:
∑( qmh) in+∑ Qin+ Wsys=∑( qmh) out+∑ Qout
(2)
In the formula: Wsys is the system power consumption, kW; ∑ (qmh) in is the inlet enthalpy value multiplied by mass flow rate, kW; ∑ Qin is the input heat, kW; ∑ (qmh) out is the outlet enthalpy value multiplied by mass flow rate, kW; ∑ Qout is the output heat, kW.
System energy efficiency ratio:
COP= Qevap/ Wsys
(3)
In the formula: Qevap is the heat exchange capacity on the cold plate side of the battery, kW, calculated using the enthalpy difference between the inlet and outlet of the battery cold plate; Wsys is the system power consumption, kW, which is the sum of compressor power consumption and outdoor fan power consumption.
Table 2 Measurement Equipment and Parameters
Tab.2 Measuring equipment and parameters
Analyze the uncertainty of the test results, and calculate the experimental uncertainty based on the Moffat formula [1] for non directly measured system parameters such as system heat transfer and COP. After calculation, the uncertainty of refrigeration capacity and COP of the refrigerant direct cooling and heating management system under the given working conditions is 6.2% and 8.3%, respectively.
f= f( Y1, Y2, Y3…)
(4)
(5)
2.2
System cooling performance
Figure 6 shows the variation of surface temperature on the cold plate of the battery over time under a simulated battery heating capacity of 5 kW, given a silicone rubber heating plate at an ambient temperature of 30 ℃ in the UDDS testing condition.

Figure 6 Time variation of battery cold plate temperature under 5 kW operating condition
Fig.6 Time-evolution of the temperature of the battery cooling plate under 5 kW condition
The start-up time of the testing system components is 15 seconds after the compressor starts, and the simulated heat source is turned on. Due to the efficient cooling characteristics of the new blow expansion direct cooling system, the surface temperature at the inlet of the cold plate drops rapidly. After 40 seconds, the average temperature drops from 30 ℃ to below 20 ℃. However, in the early stage of system operation, the refrigerant at the outlet of the battery cold plate overheats excessively, and the convective heat transfer coefficient between the cold plate and the refrigerant is small. Therefore, the surface temperature at the outlet of the battery cold plate shows a trend of briefly increasing and then rapidly decreasing. The temperature distribution of the entire cold plate measurement point meets the temperature control requirements at around 150 seconds, and the temperature of the cold plate maintains dynamic equilibrium after 300 seconds. Based on the above analysis, it can be concluded that the system has a fast cooling rate and can quickly respond to battery side thermal management needs.
2.3 System average temperature performance
The thermodynamic process of refrigerant in a cold plate is forced convection heat transfer through boiling inside the tube. Under the ideal state of ignoring the pressure drop inside the pipeline, the refrigerant pressure remains constant. Combined with the thermodynamic characteristics of temperature and pressure one-to-one correspondence in the two-phase region, the temperature will remain constant. In the actual heat transfer process, as the refrigerant flows inside the cold plate, due to the presence of pressure drop, the temperature of the refrigerant inside the cold plate will gradually decrease along the process, reaching the lowest value at a certain point in the process until the temperature gradually rises after overheating. The heat transfer process between the battery cold plate and the internal refrigerant is forced convection heat transfer. The surface temperature of the cold plate will also decrease along the process, but there is a difference between the critical point of temperature rise of the cold plate and the refrigerant. When the dryness of the refrigerant inside the cold plate rises to a certain critical point and the refrigerant flow pattern changes, the heat transfer deterioration leads to a decrease in the heat transfer coefficient of the convective heat transfer surface, and the temperature of the cold plate gradually increases.
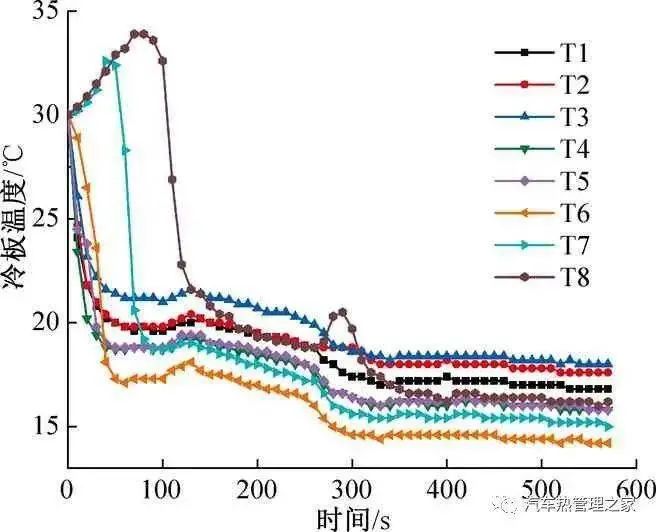
Figure 7 Temperature distribution of battery cold plate under 6 kW operating condition
Fig.7 The temperature distribution of the cooling plates under 6 kW condition
As mentioned earlier, each battery cold plate is equipped with 8 K-type thermocouples, and the thermocouple labels from inlet to outlet are T1 to T8 according to the cooling conditions. Figure 7 shows the temperature distribution on the surface of the battery cold plate over time when the heating power of the simulation module during charging and discharging is 6 kW. From Figure 7, it can be seen that the temperature change trend from T1 to T8 satisfies the above theory. The temperature of the battery cold plate decreases along the process to the lowest point T6, and after T6, the temperature begins to rise, indicating that the heat transfer inside the cold plate begins to deteriorate near T6, and the convective heat transfer decreases. When controlling the superheat at the outlet of the battery cold plate to 2 K, considering the flash caused by the pressure drop caused by the change in the inlet and outlet pipe diameter of the cold plate, the refrigerant state on most areas of the battery cold plate will always be in the two-phase zone, so the surface temperature at the outlet of the battery cold plate is basically equal to that at the inlet.
Figure 8 shows the variation of the maximum temperature difference of the battery cold plate with heating power. As shown in Figure 8, within the heating power range of 3-6 kW, while ensuring the uniformity of the battery cold plate temperature, the surface temperature of the cold plate in the direct cooling system can be controlled at 15-20 ℃. As the heating rate of the simulated heat source increases, the surface temperature of the battery cold plate increases. When the heating power increases from 3 kW to 6 kW, the maximum surface temperature of the battery cold plate increases from 17.45 ℃ to 20.86 ℃. On the other hand, as the heating power increases, the maximum temperature difference on the surface of the cold plate increases, and the temperature uniformity performance decreases. This is due to the increase in the frictional resistance and local resistance inside the cold plate. However, within the given power range, the maximum temperature difference on the surface of the cold plate can be accurately controlled within 4 ℃, meeting the required temperature uniformity requirements between battery modules.
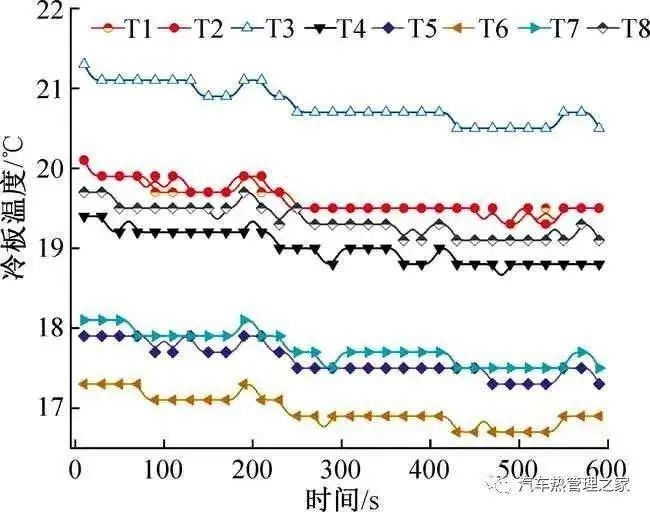
Figure 8: Maximum temperature difference of battery cold plate as a function of heating power
Fig.8 The maximum temperature difference of the cooling plates under different heating powers
2.4 Cold Plate Pressure Drop Performance
Figure 9 shows the variation of pressure drop at the inlet and outlet of the battery cold plate with heating power. As shown in Figure 9, with the increase of heating power, the mass flow rate of refrigerant in the system increases, the flow rate of refrigerant in the cold plate increases, and the pressure drop of the cold plate gradually increases. At the maximum heating power of 6 kW, the maximum pressure drop at the inlet and outlet of the battery cold plate is 89 kPa. After analysis, due to the sudden change in pipe diameter at the inlet and outlet, the pressure drop here accounts for a large proportion of the total pressure drop. Although the pressure drop in the internal flow channel of the cold plate will increase compared to the direct flow channel, the hexagonal flow channel achieves better temperature uniformity within an acceptable pressure drop range.
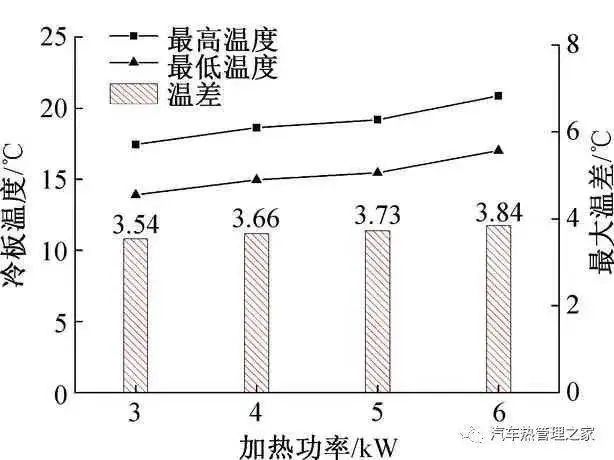
Figure 9: The variation of pressure drop at the inlet and outlet of the battery cold plate with heating power
Fig.9 The pressure drop of the cooling plate under different heating powers
2.5 Overall System Performance
Figure 10 shows the changes in high and low pressure and COP of the system with heating power under the control of the expansion valve to control the superheat at the outlet of the cold plate at 2K under the UDDS standard operating environment temperature.
As shown in Figure 10, in order to meet the temperature range and uniformity of the battery cold plate, with the increase of heating power, the speed of the electric compressor increases, the mass flow rate of the system refrigerant increases, and the system pressure drop increases. Therefore, the high and low pressure difference increases, and the system COP decreases. When the heating power increases from 3 kW to 6 kW, although the system energy efficiency decreases from 3.42 to 2.82, the COP remains stable above 2.8 within the given operating range.
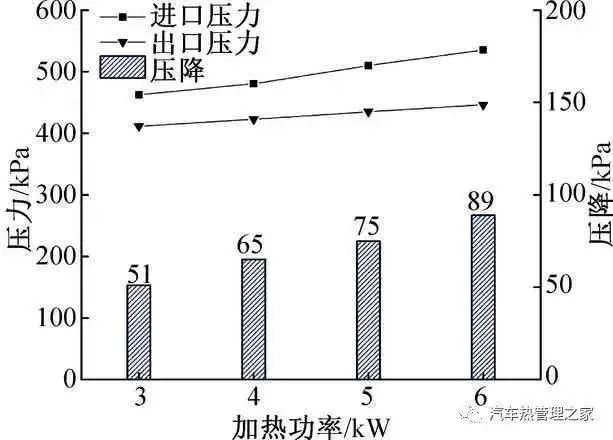
Figure 10 Changes in system high and low pressure and COP with heating power
Fig.10 The suction pressure, discharge pressure and COP under different heating powers
3 Conclusion
This article proposes a new type of refrigerant direct cooling battery thermal management system using a new honeycomb single-sided blown aluminum plate as the battery cold plate. The new cold plate is designed and a system testing bench is built. Based on the test results, the temperature control performance and overall system performance of the cold plate are analyzed. The following conclusion has been drawn:
1) Compared with the traditional harmonica tube flow channel, the new blowing and expanding cold plate increases the heat transfer area on the power battery side, and the system can quickly respond to the heat demand on the power battery side, achieving rapid cooling. At a given heating power of 5 kW, the average temperature of the battery cooling plate decreases from 30 ℃ to about 20 ℃ in approximately 150 seconds. Compared with liquid cooling systems and harmonica tube channels, the cooling efficiency of the system is higher.
2) The new type of blowing expansion cold plate direct cooling system can control the temperature of the battery cold plate within the range of heating power of 3-6 kW, and the maximum temperature difference can be maintained below 4 ℃, meeting the requirements of temperature control and temperature uniformity for power batteries. The temperature of measurement points T1 to T6 gradually decreases due to internal pressure drop, and then the temperature of T6 to T8 gradually increases due to dryness increase and heat transfer deterioration. The pressure drop of the cold plate increases with the increase of refrigeration capacity, and the maximum pressure drop is 89 kPa at 6 kW.
3) The UDDS operating condition controls the superheat at the outlet of the cold plate to 2K, and the system COP decreases with the increase of heating power and the increase of high and low pressure difference in the system, stabilizing at 2.8 or above.
